1.0 Introduction
North Tees and Hartlepool NHS Foundation Trust (NTHFT) are required to carry out gender pay gap (GPG) reporting under the Equality Act 2010 (Gender Pay Gap Information Regulations 2017).
It is important to understand that gender pay gap and equal pay are two distinct concepts:
Equal Pay is concerned with male and female employees earning equal pay for the same jobs, similar jobs or work of equal value.
The gender pay gap is about the difference between male and female employees’ average pay within an organisation.
Reporting the gender pay gap involves carrying out six calculations that show the difference between the average earnings of male and female employees within NTHFT. It does not involve publishing individual employee data.
The information contained within this report relates to 2024/25 and is based on the snapshot date of 31 March 2025.
2.0 Gender profile
As at the snapshot date of 31st March 2025
NTHFT employed 5,061 employees.
The overall gender profile for NTHFT is reported as:
- Male: 16%
- Female: 84%
When compared against the NHS as a whole, the national average which reports female representation at 76% and male at 24, the gender profile shows that female representation is 8% higher within NTHFT.
3.0 Gender pay gap
3.1 Mean and median analysis
The gender pay gap measured by the median hourly rate is calculated as the mid-point of the salary distribution range for male and female employees.
The gender pay gap measured by the median hourly rate is:
21.77% for NTHFT (this has shown a 1.06% negative increase on the previous year)
| Gender | Average hourly rate | Median hourly rate |
|---|---|---|
| Female | £30.53 | £22.99 |
| Male | £19.63 | £17.99 |
| Difference | £10.90 | £5.01 |
| Pay gap % | 35.71% | 21.77% |
To calculate the mean (average) hourly rate, earnings are totalled and then divided by the number of male and female employees.
The gender pay gap measured by the average hourly rate is 35.71% f (an increase of 2.44% since the previous year)
A summary showing the position for the previous five years as at 31 March (2021 – 2025) is contained at Appendix 1 of this report.
3.2 Quartile reporting
The table below illustrates the gender distribution in NTHFT across four equally sized pay quartiles. The values for 2024 are shown in brackets.
| Quartile | Female | Male | Female % | Male % |
|---|---|---|---|---|
| Upper quartile (Q4) | 891 (887) | 374 (335) | 70.43% (71.59%) | 29.57% (28.41%) |
| Upper middle quartile (Q3) | 1,119 (1,099) | 146 (140) | 88.46% (88.70%) | 11.54% (11.30%) |
| Lower Middle quartile (Q2) | 1,125 (1,096) | 140 (142) | 88.93% (88.53%) | 11.07% (11.47%) |
| Lower quartile (Q1) | 1,134 (1,111) | 132 (127) | 89.57% (89.74%) | 10.43% (10.26%) |
3.3 Where is the pay gap?
The increase in the mean (average) gender pay gap can be attributed to a number of factors:
- A slight decrease in the representation of female employees in the upper and lower quartiles (Q4 and Q1), resulting in an increase in female representation in the middle 2 quartiles (Q3 and Q2).
- The difference in average hourly rate between male and female staff has increased – resulting in an increase of £1.77 difference between male and female average salary of £9.13 in 2023/24 to £10.90 in 2024/25, therefore resulting in an overall increase.
- The median hourly increase from 2024 to 2025 was £1.93 for male employees and £1.29 for female employees, therefore resulting in an increase in the difference between male and female median average of £0.64 from £4.36 in 2023/24 to £5.01 in 2024/25, therefore resulting in an overall increase.
The changes in the quartile representation are:
- A decrease in the % of female employees in Q4: down 1.16% from 2024
- An increase in the headcount for male employees in Q4 from 335 in 2024 to 374 in 2025 with an overall increase in the % headcount of male employees in Q4: up 1.16% from 28.41 % in 2024 to 29.57% in 2025.
- An increase in the headcount for female employees in Q3 from 1099 in 2024 to 1119 in 2025 with an overall decrease in the % headcount of female employees in Q3: down 0.24% from 88.70% in 2024 to 88.46% in 2025.
- An increase in the headcount of male employees in Q3 from 140 in 2024 to 146 employees in 2025, a slight increase of 0.24%.
- An increase in the headcount of female employees in Q2 from 1096 in 2024 to 1125 employees in 2025 with an increase of 0.4%. The male equivalent was a decrease of 0.4%.
- There was also an increase in the headcount of female employees in Q1 from 1111 employees in 2024 to 1134 employees in 2025, but overall showed a slowed a slight decrease of 0.17%. The male equivalent was an increase of 0.17%.
3.4 Impact of consultant medical and dental staff
There is a greater proportion of male workers within the categories of medical and dental (M&D) and very senior manager (VSM). These roles are the highest paid workers of across the organisation and equate to 5.77% of the total workforce.
This information has been broken down further to show the impact of medical staff on the trust’s gender pay gap and this shows that if we exclude medical staff, the gap is dramatically reduced.
2024-25 medical staff
| Gender | Average hourly rate | Median hourly rate |
|---|---|---|
| Female | £49.22 | £55.79 |
| Male | £54.72 | £50.59 |
| Difference | £5.50 | £5.21 |
| Pay gap (%) | 10.05% | 9.33% |
2024-25 non-medical staff
| Gender | Average hourly rate | Median hourly rate |
|---|---|---|
| Female | £20.33 | £18.66 |
| Male | £18.66 | £17.54 |
| Difference | £1.67 | £1.11 |
| Pay gap (%) | 8.21% | 5.97% |
An overall average (mean) pay gap of 8.21%, when medical staff are excluded.
The quartile with the highest representation of male employees is the upper quartile (Q4), which represents the highest paid employees of the organisation.
Of the 374 male employees within Q4, 40% (151) are medical Consultants. There are 78 female medical Consultants, which accounts for only 8.75% of the 891 female employees in Q4. We have seen a 1% decrease in female consultants which was reported at 35% in 2024 to 34% in 2025.
The imbalance in these numbers has an impact on the overall gender pay gap.
3.5 Pay band review
The proportion of females and males employed within each pay band is shown in the chart below. This illustrates the proportion of female and male staff within each of the pay bands.
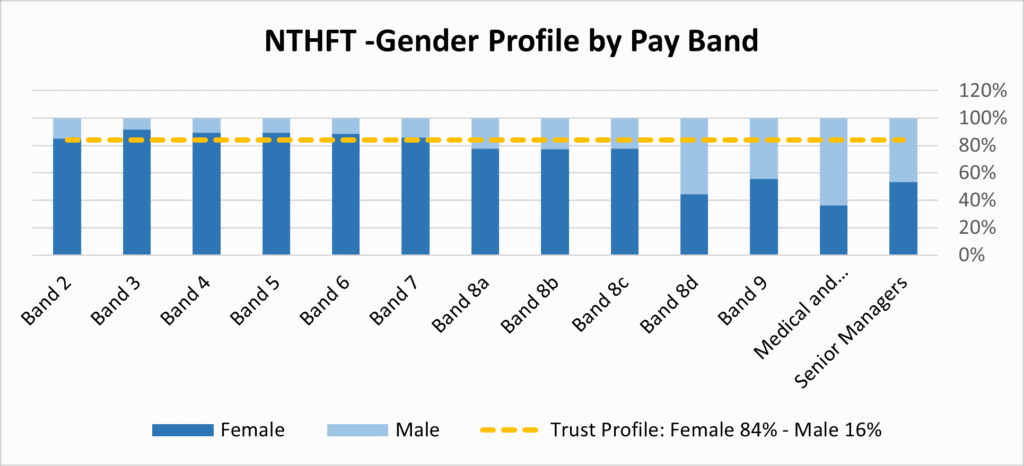
It can be seen that a number of the pay grades are broadly representative of the trust’s gender ratio (84:16), however there is higher female representation employed in bands 2-7 and higher male representation at bands 8d, and for medical and dental staff.
All employees of the trust, with the exception of medical and dental staff (M&D) and very senior managers (VSM) are paid on national Agenda for Change (AfC) pay terms and conditions of service.
The terms and conditions set out the band structures and pay for all employees to ensure transparency, fairness and equal treatment for all.
4.0 Bonus pay gap
This section of the report is focused on the gender bonus pay gap %. This is reported as being an average of 38.68% for NTHFT (an increase of 12.77% since the 2024 report).
The trust does not operate a bonus scheme, however consultant medical and dental staff were eligible to apply for clinical excellence awards (CEA), which are considered to be a bonus payment and therefore form part of the gender pay gap calculations.
Since agreement of the national pay award for medical consultants, CEA’s have now been suspended to new applications. Moving forward, the trust is still required to pay CEA payments that were historically awarded to consultants prior to 1 April 2018. These are protected until they have terminated their employment, therefore it is not possible to control or influence our bonus pay gaps due to the continuing historical CEA payments.
The tables below provide a breakdown of the average mean and median rate of bonus pay (CEA’s):
| Gender | Means bonus pay | Median bonus pay |
|---|---|---|
| Male | £10,150.79 | £6,032.04 |
| Female | £6,224.69 | £5,296.89 |
| Difference | £3,926.10 | £735.15 |
| Bonus pay gap | 38.68% | 12.19% |
The average gender bonus rate of pay is reported at 38.68% for 2025, which has shown an increase of 12.77% from the previous year.
The median difference is reported at 12.19%
4.1 Where is the average bonus pay gap?
The historical CEA awards have been paid to a total of 45 male consultants and 16 female consultants
The trust’s consultant medical workforce are predominantly male; therefore, it is unsurprising that the gender bonus gap % indicates that male consultants earn a higher rate of average bonus pay (CEAs) than female consultants. This is because there are more male consultants employed by the trust and more male consultants who are in receipt of a historical CEA than female consultants.
5.0 Benchmarking
The NHS as a whole does not undertake national reporting of the gender pay gap, however the information for each individual NHS organisation is available online via the government’s equalities office.
All trusts within the ICS have published their gender pay gap data for 2023-2024 and no rusts have published data for the 2024-25 report, although it is noted that the deadline for our reporting is not until 30 March 2026.
In respect of the average hourly rate of pay, all NHS organisations within the ICS report that male employees receive a higher average rate of pay when compared to female employees.
6.0 Actions to address our gender and bonus pay gap
Our actions to improve the gender pay gap across UHT align with the wider organisational strategic goals, specifically ‘Valuing our People’. They also support our commitments to the NHS People Plan.
We continue to commit to address our gender pay gaps and we will look to implement the following actions:
- Develop initiatives as part of our talent management plan to support more women in senior roles, particularly amongst the medical and dental workforce. To narrow the gap, we need to focus on increasing the proportion of women staff in the upper pay quartile, particularly women consultants.
- Continue to apply the national NHS pay frameworks of Agenda for Change (AfC) and conditions for medical and dental staff. This will continue to ensure that job descriptions are evaluated using the national job evaluation system to determine appropriate pay bandings and assure equal pay for equal roles. This system reduces the risk of any equal pay issues arising
- Analyse the data in terms of intersectionality and to drill down the data further to identify any specific trends
- Analyse NHS Staff Survey data, particularly focussing on the experience of women.
- We will continue to encourage our senior leaders to role model working flexibly and to champion flexible working arrangements.
- The trust is committed to tackling health inequalities. Our workforce health and wellbeing procedures, policies and our strategy will all contribute to closing the gender pay gap by understanding and tackling the inequalities faced by women belonging to specific groups, based on characteristics such as ethnicity, age, deprivation and profession.
- We continue to promoting and updating workforce policies in line with current best practice to promote gender equality, fairness and health literacy.
- The women’s and men’s networks offers a place for staff to come together, share experiences and facilitate learning and development. The network will also assist in the shaping and delivery of organisational strategy and policy, working with us to improve staff experience on specific gender related issues and adding more depth to our gender pay gap action plan.
- Further analyse is to be reported on the ethnicity and disability pay gap and further breakdown of data relating to intersectionality.
Appendix: Gender pay gap reporting – five year analysis
| Report indicator | 2020 | 2021 | 2022 | 2023 | 2024 | 2025 | Difference for 2025 |
|---|---|---|---|---|---|---|---|
| Difference in hourly rate of pay Mean (average) | 35.67% | 36.73% | 35.69% | 44.65% | 33.27% | 35.71% | +2.44% |
| Difference in hourly rate of pay Median (middle) | 22.34% | 24.73% | 23.46% | 23.51% | 20.71% | 21.77% | +1.06% |
| Difference in Bonus Pay Mean (average) | 17.00% | 21.99% | 60.64% | 19.25% | 25.91% | 38.68% | +12.77% |
| Difference in bonus pay Median (middle) | 0% | 14.67% | 0.00% | 0.00% | 0.00% | 12.19% | +12.19% |
| % of male employees who received bonus pay | 5.71% | 7.08% | 100.00% | 10.80% | 14.89% | 5.31% | +4.09% |
| % of female employees who receive bonus pay | 0.57% | 0.59% | 100.00% | 1.25% | 1.42% | 0.35% | +0.17% |
| Upper Quartile (Q4) male | 28.75% | 28.98% | 29.51% | 27.36% | 28.41% | 29.57% | + 1.16% |
| Upper Quartile (Q4) female | 71.25% | 71.02% | 70.49% | 72.64% | 71.59% | 70.43% | – 1.16% |
| Upper Middle (Q3) male | 12.32% | 11.49% | 9.62% | 12.27% | 11.30% | 11.54% | +0.24% |
| Upper Middle (Q3) female | 87.68% | 88.51% | 90.38% | 87.73% | 88.70% | 88.46% | -0.24% |
| Lower Middle (Q2) male | 11.07% | 11.23% | 10.06% | 12.20% | 11.47% | 11.07% | – 0.40% |
| Lower Middle (Q2) female | 88.93% | 88.77% | 89.94% | 87.80% | 88.53% | 88.93% | + 0.40% |
| Lower (Q1) male | 10.63% | 9.83% | 10.50% | 11.87% | 10.26% | 10.43% | +0.17% |
| Lower (Q1) female | 89.37% | 90.17% | 89.50% | 88.13% | 89.74% | 89.57% | -0.17% |